作者:Ted Lee
我們在《Python玩AI,你也可以 — 從CVZone入門吧!》一文中,成功地以「註解」的方式,將陳安會老師分享的CVZone小專案的「程式碼」拆解出最小的原子元素(atomic elements):控攝影機->手部辨識。
本文假設我們已事先知曉Python Tkinter視窗程式(window programming)的流程(圖1)[2]。接著,我們再向Claude尋求協助,逐步生成流程中各部驟所對應的程式碼,並藉此來一窺視窗程式設計的風貌。
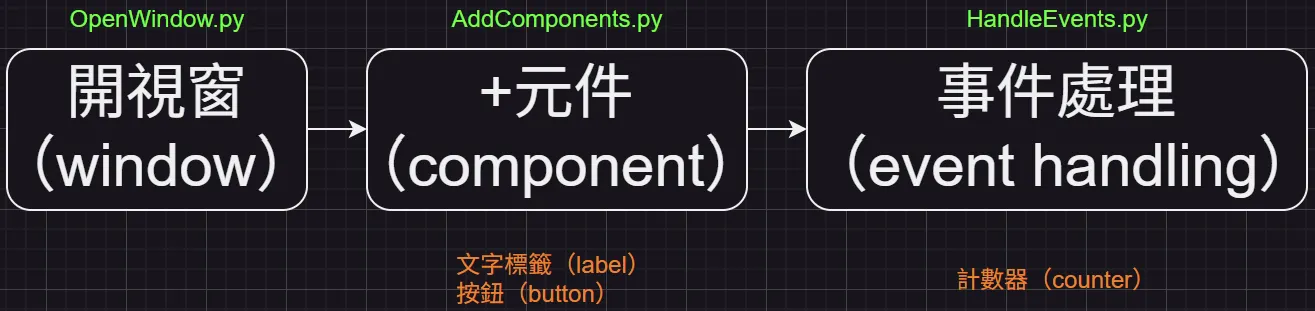
圖1:Python Tkinter視窗程式設計流程
一、開視窗
我們在Claude中下達以下咒語(prompt):
(人設)你是Python Tkinter權威
(任務)用最少的程式碼開大視窗,標題寫:Powered by 泰布布
(輸出)Python程式碼
然後,我們就可以得到以下短短5行開一個新視窗的程式碼,它的執行畫面如圖2所示。
OpenWindow.py
import tkinter as tkroot = tk.Tk()

root.title("Powered by 泰布布")

root.geometry("800x600")

root.mainloop()
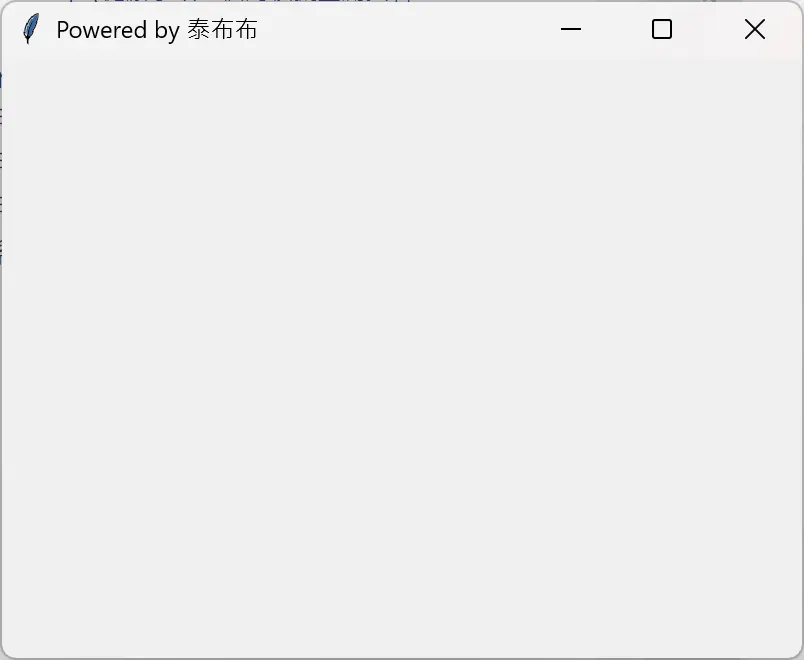
圖2:OpenWindow.py的執行畫面
二、+元件
我們在Claude中下達以下咒語(prompt):
(任務)加一個Label和Button
(輸出)Python程式碼
然後,我們就可以得到以下短短13行,在視窗中加入一個文字標籤及按鈕的程式碼,它的執行畫面如圖3所示。
AddComponent.py
import tkinter as tk


root = tk.Tk()

root.title("Powered by 泰布布")

root.geometry("800x600")


label = tk.Label(root, text="歡迎使用泰布布程式", font=("Arial", 16))

label.pack(pady=20)


button = tk.Button(root, text="點擊我", font=("Arial", 12))

button.pack(pady=10)


root.mainloop()
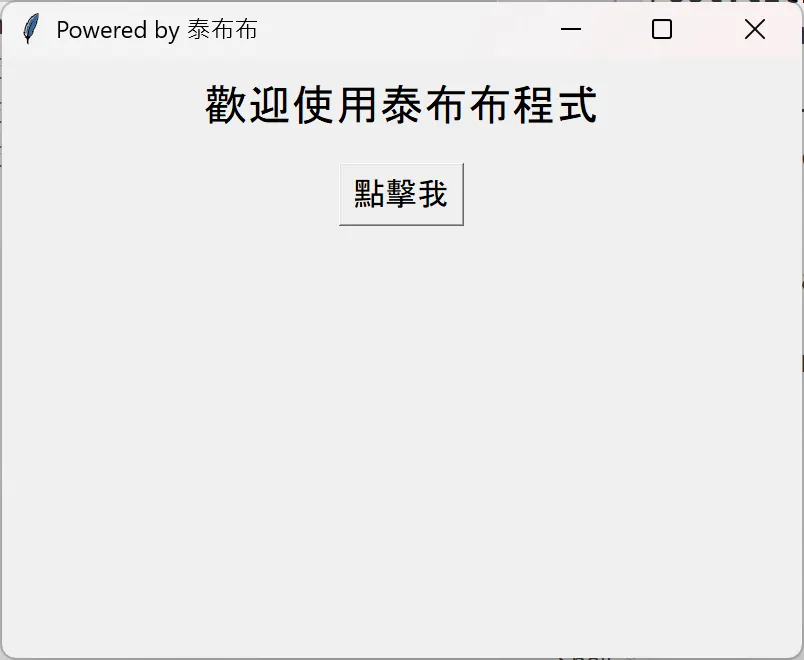
圖3:AddComponent.py的執行畫面
三、事件處理
我們在Claude中下達以下咒語(prompt):
(任務)在Label上顯示按鈕被按下的次數
(輸出)Python程式碼
然後,我們就可以得到以下短短20行的計數器程式碼,它的執行畫面如圖4所示。
HandleEvents.py
import tkinter as tk


count = 0


def click():

    global count

    count += 1

    label.config(text=f"按鈕已被點擊 {count} 次")


root = tk.Tk()

root.title("Powered by 泰布布")

root.geometry("800x600")


label = tk.Label(root, text="按鈕已被點擊 0 次", font=("Arial", 16))

label.pack(pady=20)


button = tk.Button(root, text="點擊我", font=("Arial", 12), command=click)

button.pack(pady=10)


root.mainloop()
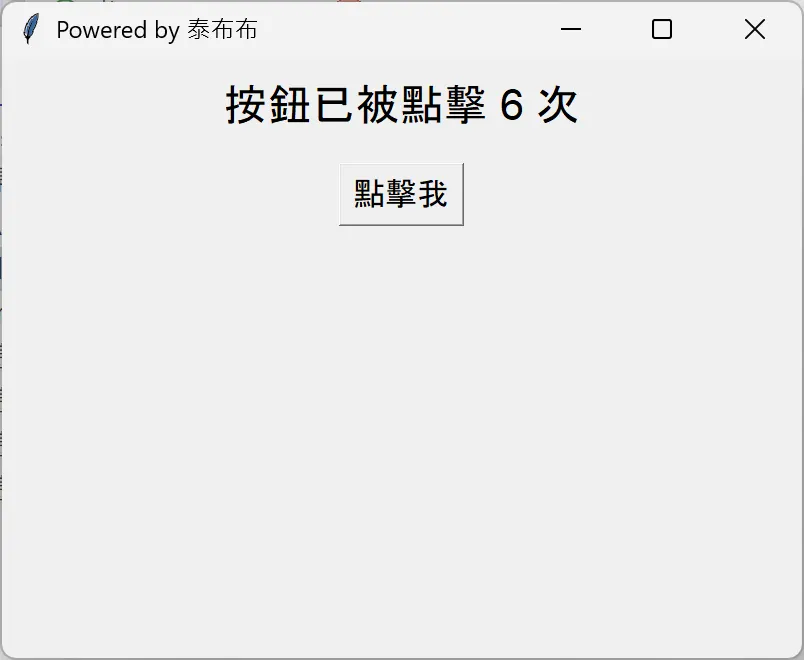
圖4:HandleEvents.py的執行畫面
四、健康手環監測系統
在圖5中,我事先準備了模擬的健康手環一個月的各項監測資料:
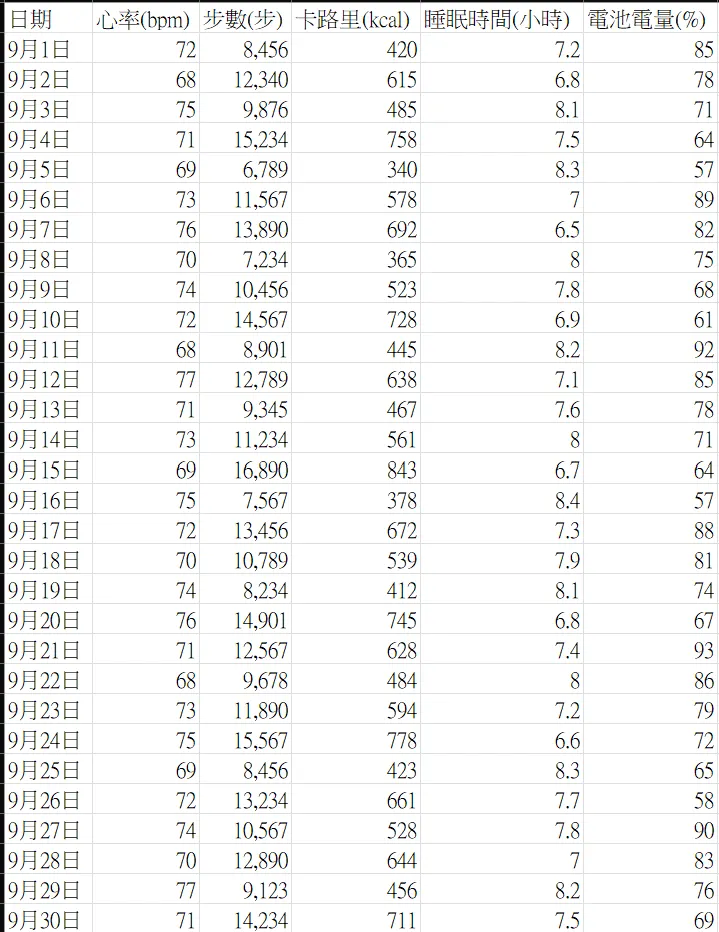
圖5:健康手環監測資料
接著,我們在Claude中下達以下咒語(prompt):
(任務)
1.可以讀入外部的CSV資料 :健康手環一個月模擬監測資料.csv
2.可以選擇各欄位畫折線圖及圓餅圖
(輸出)Python程式碼
然後,我們就可以得到以下短短二十行的計數器程式碼,它的執行畫面如圖5所示。
健康手環監測系統.py
import tkinter as tk

from tkinter import filedialog, ttk, messagebox

import pandas as pd

import matplotlib.pyplot as plt

from matplotlib.backends.backend_tkagg import FigureCanvasTkAgg

import matplotlib

matplotlib.use('TkAgg')


# 設定中文字體支援

plt.rcParams['font.sans-serif'] = ['Microsoft YaHei', 'SimHei', 'Arial Unicode MS']  # 設定中文字體

plt.rcParams['axes.unicode_minus'] = False  # 解決負號顯示問題


class DataAnalyzer:

    def __init__(self):

        self.root = tk.Tk()

        self.root.title("Powered by 泰布布 - CSV資料分析器")

        self.root.geometry("1000x700")

        self.df = None

        self.setup_ui()


    def setup_ui(self):

        # 檔案讀取區

        file_frame = tk.Frame(self.root)

        file_frame.pack(pady=10)


        tk.Button(file_frame, text="讀取CSV檔案", command=self.load_csv,

                 font=("Arial", 12), bg="#4CAF50", fg="white").pack(side=tk.LEFT, padx=5)


        self.file_label = tk.Label(file_frame, text="未選擇檔案", font=("Arial", 10))

        self.file_label.pack(side=tk.LEFT, padx=10)


        # 欄位選擇區

        select_frame = tk.Frame(self.root)

        select_frame.pack(pady=10)


        tk.Label(select_frame, text="選擇欄位:", font=("Arial", 11)).pack(side=tk.LEFT)

        self.column_var = tk.StringVar()

        self.column_combo = ttk.Combobox(select_frame, textvariable=self.column_var, width=20)

        self.column_combo.pack(side=tk.LEFT, padx=10)


        # 圖表按鈕

        btn_frame = tk.Frame(self.root)

        btn_frame.pack(pady=10)


        tk.Button(btn_frame, text="折線圖", command=self.plot_line,

                 font=("Arial", 11), bg="#2196F3", fg="white").pack(side=tk.LEFT, padx=5)

        tk.Button(btn_frame, text="圓餅圖", command=self.plot_pie,

                 font=("Arial", 11), bg="#FF9800", fg="white").pack(side=tk.LEFT, padx=5)

        tk.Button(btn_frame, text="清除圖表", command=self.clear_plot,

                 font=("Arial", 11), bg="#f44336", fg="white").pack(side=tk.LEFT, padx=5)


        # 圖表顯示區

        self.plot_frame = tk.Frame(self.root)

        self.plot_frame.pack(fill=tk.BOTH, expand=True, padx=10, pady=10)


    def load_csv(self):

        file_path = filedialog.askopenfilename(

            title="選擇CSV檔案",

            filetypes=[("CSV檔案", "*.csv"), ("所有檔案", "*.*")]

        )

        if file_path:

            try:

                self.df = pd.read_csv(file_path, encoding='utf-8')

                self.file_label.config(text=f"已載入: {file_path.split('/')[-1]}")


                # 更新欄位選項

                numeric_columns = self.df.select_dtypes(include=['number']).columns.tolist()

                self.column_combo['values'] = numeric_columns

                if numeric_columns:

                    self.column_combo.set(numeric_columns[0])


                messagebox.showinfo("成功", f"成功載入 {len(self.df)} 筆資料")


            except Exception as e:

                messagebox.showerror("錯誤", f"讀取檔案失敗: {str(e)}")


    def plot_line(self):

        if self.df is None:

            messagebox.showwarning("警告", "請先載入CSV檔案")

            return


        column = self.column_var.get()

        if not column:

            messagebox.showwarning("警告", "請選擇要繪製的欄位")

            return


        self.clear_plot()


        fig, ax = plt.subplots(figsize=(8, 5))

        ax.plot(range(len(self.df)), self.df[column], marker='o', linewidth=2, markersize=4)

        ax.set_title(f"{column} - 折線圖", fontsize=14, fontweight='bold')

        ax.set_xlabel("資料點", fontsize=12)

        ax.set_ylabel(column, fontsize=12)

        ax.grid(True, alpha=0.3)

        plt.tight_layout()


        canvas = FigureCanvasTkAgg(fig, self.plot_frame)

        canvas.draw()

        canvas.get_tk_widget().pack(fill=tk.BOTH, expand=True)


    def plot_pie(self):

        if self.df is None:

            messagebox.showwarning("警告", "請先載入CSV檔案")

            return


        column = self.column_var.get()

        if not column:

            messagebox.showwarning("警告", "請選擇要繪製的欄位")

            return


        self.clear_plot()


        # 將數值分成5個區間做圓餅圖

        data = self.df[column].dropna()

        bins = pd.cut(data, bins=5, precision=0)

        value_counts = bins.value_counts()


        fig, ax = plt.subplots(figsize=(8, 6))

        colors = ['#ff9999', '#66b3ff', '#99ff99', '#ffcc99', '#ff99cc']

        wedges, texts, autotexts = ax.pie(value_counts.values, labels=value_counts.index,

                                         autopct='%1.1f%%', colors=colors, startangle=90)

        ax.set_title(f"{column} - 數據分佈圓餅圖", fontsize=14, fontweight='bold')

        plt.tight_layout()


        canvas = FigureCanvasTkAgg(fig, self.plot_frame)

        canvas.draw()

        canvas.get_tk_widget().pack(fill=tk.BOTH, expand=True)


    def clear_plot(self):

        for widget in self.plot_frame.winfo_children():

            widget.destroy()


    def get_english_name(self, chinese_name):

        """將中文欄位名轉換為英文顯示"""

        name_map = {

            '心率(bpm)': 'Heart Rate (bpm)',

            '步數(步)': 'Steps',

            '卡路里(kcal)': 'Calories (kcal)',

            '睡眠時間(小時)': 'Sleep Hours',

            '電池電量(%)': 'Battery (%)'

        }

        return name_map.get(chinese_name, chinese_name)


    def run(self):

        self.root.mainloop()


if __name__ == "__main__":

    app = DataAnalyzer()

    app.run()
圖6:健康手環監測系統.py的執行動畫
[1]六種授權條款。
[2]我們也可以先使用GenAI來拆解問題,然後將小問題的程式碼解答往上逐一組成大問題的答案。
(作者為本刊專欄作家,本文同步表於作者部落格,原文連結;責任編輯:謝涵如)

- 用GenAI自動拆解程式碼學習:GenAI時代的新程式學習法 - 2025/12/29
- 「動手」之前 你需要了解電腦系統的基礎知識點! - 2025/11/28
- GenAI拆解學習:以「健康手環監測系統」示例 - 2025/10/23
訂閱MakerPRO知識充電報
與40000位開發者一同掌握科技創新的技術資訊!


