作者:CAVEDU 教育團隊
Wio Terminal 自帶的LCD螢幕讓我們檢視資料更容易了。藉由將數值顯示在螢幕上比單純使用Serial monitor更方便,也能在沒有電腦的時候使用。但螢幕的大小有限,因此需要有翻頁功能,此時就需要使用中斷(Interrupt),這也是開發 Arduino 這類 MCU 程式時的重要技巧。
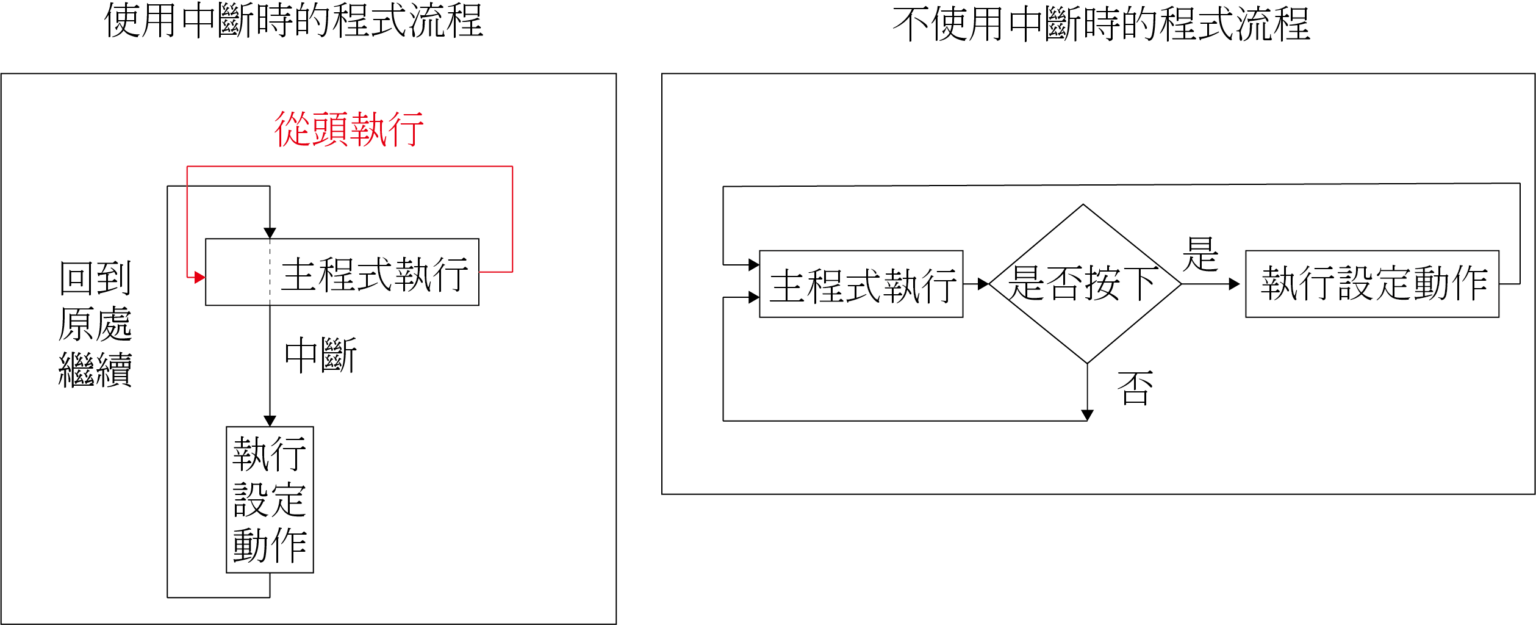
使用中斷(Interrupt)的好處是程式會直接停下當下的動作,優先執行中斷事件所指定的程式碼,這與 “delay()” 不同,且可以避免程式執行到一半時按下按鈕沒有反應。
底下是使用兩種方式時的簡單流程圖:
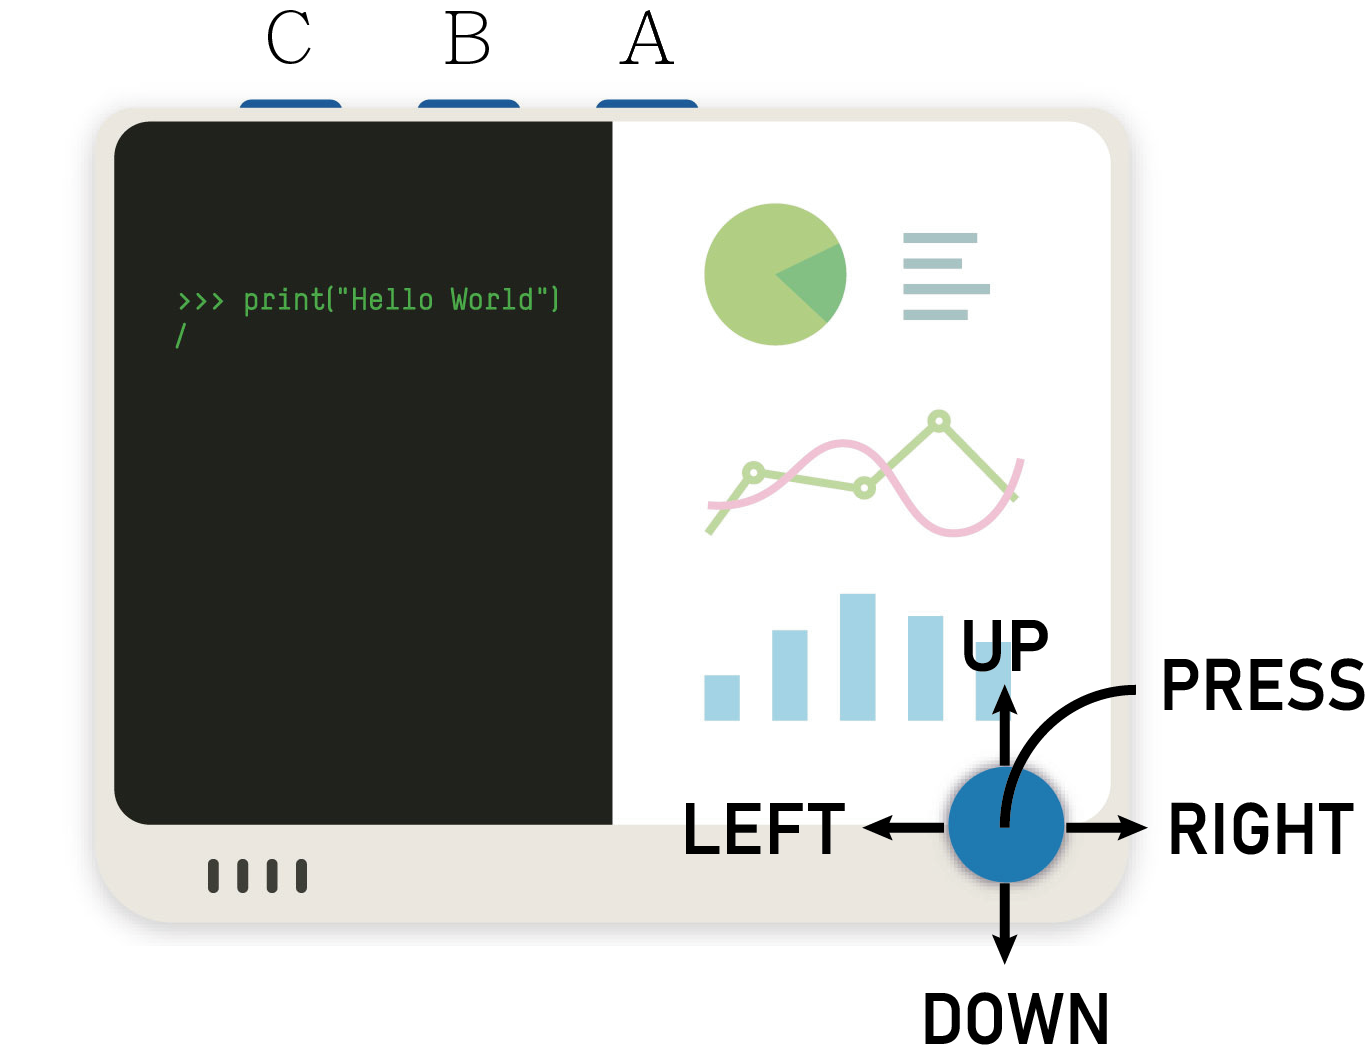
Wio Terminal可使用五向開關以及上面的ABC三個按鈕觸發中斷。
注意:由於五向開關和按鈕A的中斷連接腳位是一樣的,同時宣告會導致兩個都無法使用,只能擇一宣告
以下是中斷的宣告以及使用方式:
 //設定為上拉或下拉電阻

pinMode(WIO_5S_UP, INPUT_PULLUP);


//開啟觸發腳位

//button_handler_up 代表要執行的函式名稱

attachInterrupt(digitalPinToInterrupt(WIO_5S_UP),  button_handler_up, FALLING);


//觸發後的執行動作

void button_handler_up() {

    Serial.println("button Up");

    delay(100);

    mode = 1;

}
上述程式碼中,WIO_5S_UP 指的是 Wio Terminal 五向開關的向上按鈕,此外還有 “WIO_5S_DOWN” , “WIO_5S_LEFT” ,”WIO_5S_RIGHT” 和 “WIO_5S_PRESS2″ 等同一個按鈕的不同事件。
另外還有三個按鈕可用:”WIO_KEY_A” ,”WIO_KEY_B” 與 “WIO_KEY_C”,如下圖:
Arduino 的 attachinterrupt 指令的詳細介紹請點我,如果只需使用基礎功能可以使用本文的範例程式碼即可。更多細節設定就請自行參考連結中的說明。
Wio temrinal 中斷範例
以下範例使用Wio Terminal內建的光感測器、加速度和聲音感測器以及五向項開關的右、下、左,當然還有顯示用的LCD,由於都是內建的元件,因此額外接線,Wio Terminal 拿出來就好,非常方便。
此外本範例程式也會使用到 seeed 的 line_chart 範例,筆者覺得該範例相當實用,可以輕鬆把各類資料以折線圖的方式顯示於 Wio Terminal 內建的 LCD。
 TFT_eSPI tft;

TFT_eSprite spr = TFT_eSprite(&tft);

tft .begin();

tft.setRotation(3);

spr.createSprite(TFT_HEIGHT, TFT_WIDTH);

spr.setRotation(3);

spr.setTextColor(TFT_BLACK, TFT_BLACK);

spr.setTextSize(2);


if (data.size() == MAX_SIZE) {

//當資料筆數太多時將最舊一筆的數值丟棄

        data.pop();

    }

    data.push(val); //將最新的一筆資料寫入


    //設定圖表標題部分,此處是聲音感測器

    auto header =  text(0, 0)

                .value("Microphone Reading")

                .align(center)

                .color(TFT_WHITE)

                .valign(vcenter)

                .width(spr.width())

                .thickness(2);


    header.height(header.font_height(&spr) * 2);

    header.draw(&spr);


  //折線圖設定

  //這重點在於.value(data) 中的data

  //就是希望由折線圖所繪製的數值

  //這些數值應先儲存於陣列中


   auto content = line_chart(20, header.height());

         content

                .height(spr.height() - header.height() * 1.5)

                .width(spr.width() - content.x() * 2)

                .based_on(0.0)

                .show_circle(false)

                .max_size(MAX_SIZE)

                .value(data)

                .color(TFT_RED)

                .backgroud(TFT_WHITE)

                .draw(&spr);
最後分別是三種感測器的畫面顯示,可使用五向開關的左、下、右來即時切換。希望本文分享的功能能對大家有幫助,完整程式碼列於文末。
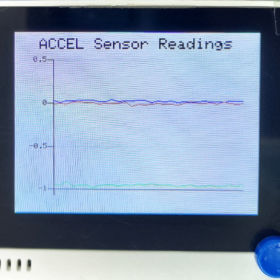
加速度感測器
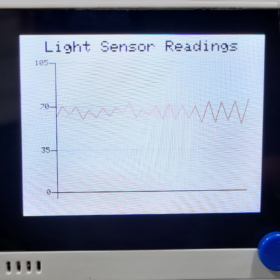
光感測器
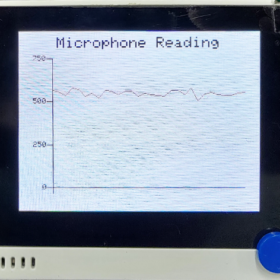
聲音感測器
complete code – wio terminal interrupt demo
 #include"LIS3DHTR.h" //加速度感測器函式庫

#include

#include

#include "seeed_line_chart.h" //Wio Terminal圖表函式庫

#define MAX_SIZE 30

LIS3DHTR  lis;


int mode;

int brightness;


doubles data;

doubles accelerator_readings[3];


//觸發啟動後所要執行的動作

void button_handler_down() { Serial.println("button Down");delay(100); mode = 1;}

void button_handler_left() { Serial.println("button left");delay(100); mode = 2;}

void button_handler_right() { Serial.println("button Right");delay(100); mode = 3;}


/*其他觸發

void button_handler_up() { Serial.println("button Up"); delay(100); mode = 4;}

void button_handler_press() { Serial.println("button Press");delay(100); mode = 5;}

void button_handler_B() { Serial.println("button Press");delay(100); mode = 6;}

void button_handler_C() { Serial.println("button Press");delay(100); mode = 7;}

*/


TFT_eSPI tft;

TFT_eSprite spr = TFT_eSprite(&tft);


void setup() {

  Serial.begin(9600);

  lis.begin(Wire1);

  lis.setOutputDataRate(LIS3DHTR_DATARATE_25HZ);

  lis.setFullScaleRange(LIS3DHTR_RANGE_2G);


  //設定五項開關為上拉或下拉電阻


  pinMode(WIO_5S_DOWN, INPUT_PULLUP);

  pinMode(WIO_5S_LEFT, INPUT_PULLUP);

  pinMode(WIO_5S_RIGHT, INPUT_PULLUP);


  /*其他設定

  pinMode(WIO_5S_UP, INPUT_PULLUP);

  pinMode(WIO_5S_PRESS, INPUT_PULLUP);

  pinMode(WIO_KEY_B, INPUT_PULLUP)

  pinMode(WIO_KEY_C, INPUT_PULLUP)

  */


  //設定按鈕被如何按下時會啟動觸發,有按下或按下後放開


  attachInterrupt(digitalPinToInterrupt(WIO_5S_DOWN),   button_handler_down,  FALLING);

  attachInterrupt(digitalPinToInterrupt(WIO_5S_LEFT),   button_handler_left,  FALLING);

  attachInterrupt(digitalPinToInterrupt(WIO_5S_RIGHT),  button_handler_right, FALLING);


  /*其他觸發設定

  attachInterrupt(digitalPinToInterrupt(WIO_5S_UP),     button_handler_up,    FALLING);

  attachInterrupt(digitalPinToInterrupt(WIO_5S_PRESS),  button_handler_press, FALLING);

  attachInterrupt(digitalPinToInterrupt(WIO_KEY_B),  button_handler_B, FALLING);

  attachInterrupt(digitalPinToInterrupt(WIO_KEY_C),  button_handler_C, FALLING);

  */


  //LCD顯示設定

  tft .begin();

  tft.setRotation(3);

  spr.createSprite(TFT_HEIGHT, TFT_WIDTH);

  spr.setRotation(3);

  spr.setTextColor(TFT_BLACK, TFT_BLACK);

  spr.setTextSize(2);

  delay(500);

}


void loop() {


  //根據觸發後更改mode的數字決定要做的動作

  switch(mode){

  //下

  case 1 :

  spr.drawString("2", 40, 40);

  chartMicro();

  break;


  //左

  case 2 :

  chartAccel();

  break;


  //右

  case 3 :

  chartLight();

  break;


  /*....

  case 4 :

  執行動作

  break

  */

  }

  //輸出畫面

  spr.pushSprite(0, 0);

}


//光感值以圖表顯示

void chartLight()

{

  brightness = analogRead(WIO_LIGHT);

  spr.fillSprite(TFT_WHITE);

  if (data.size() > MAX_SIZE)

    {

        data.pop(); // this is used to remove the first read variable

    }

    data.push(brightness); // read variables and store in data


    // Settings for the line graph title

    auto header = text(0, 0)

                      .value("Light Sensor Readings")

                      .align(center)

                      .valign(vcenter)

                      .width(spr.width())

                      .thickness(2);


    header.height(header.font_height(&spr) * 2);

    header.draw(&spr); // Header height is the twice the height of the font


    // Settings for the line graph

    auto content = line_chart(20, header.height()); //(x,y) where the line graph begins

    content

        .height(spr.height() - header.height() * 1.5) // actual height of the line chart

        .width(spr.width() - content.x() * 2)         // actual width of the line chart

        .based_on(0.0)                                // Starting point of y-axis, must be a float

        .show_circle(false)                           // drawing a cirle at each point, default is on.

        .value(data)                                  // passing through the data to line graph

        .max_size(MAX_SIZE)

        .color(TFT_RED)                               // Setting the color for the line

        .backgroud(TFT_WHITE)

        .draw(&spr);

    delay(100);

}


//加速度值以圖表顯示

void chartAccel()

{

  spr.fillSprite(TFT_WHITE);


  if (accelerator_readings[0].size() == MAX_SIZE) {

      for (uint8_t i = 0; i<3; i++){

        accelerator_readings[i].pop(); //this is used to remove the first read variable

      }

    }


  accelerator_readings[0].push(lis.getAccelerationX()); //read variables and store in data

  accelerator_readings[1].push(lis.getAccelerationY());

  accelerator_readings[2].push(lis.getAccelerationZ());

    // Settings for the line graph title

    auto header = text(0, 0)

                      .value("ACCEL Sensor Readings")

                      .align(center)

                      .valign(vcenter)

                      .width(spr.width())

                      .thickness(2);


    header.height(header.font_height(&spr) * 2);

    header.draw(&spr); // Header height is the twice the height of the font


    // Settings for the line graph

    auto content = line_chart(20, header.height()); //(x,y) where the line graph begins

    content

        .height(spr.height() - header.height() * 1.5) // actual height of the line chart

        .width(spr.width() - content.x() * 2)         // actual width of the line chart

        .based_on(0.0)                                // Starting point of y-axis, must be a float

        .show_circle(false)                           // drawing a cirle at each point, default is on.

        .value({accelerator_readings[0],accelerator_readings[1], accelerator_readings[2]})                                  // passing through the data to line graph

        .max_size(300)

        .color(TFT_BLUE, TFT_RED, TFT_GREEN)                               // Setting the color for the line

        .backgroud(TFT_WHITE)

        .draw(&spr);

    delay(10);

}


//聲音感測器以圖表顯示

void chartMicro()

{

   spr.fillSprite(TFT_WHITE);


    int val = analogRead(WIO_MIC);


    if (data.size() == MAX_SIZE) {

        data.pop();//this is used to remove the first read variable

    }

    data.push(val); //read variables and store in data


    //Settings for the line graph title

    auto header =  text(0, 0)

                .value("Microphone Reading")

                .align(center)

                .valign(vcenter)

                .width(spr.width())

                .thickness(2);


    header.height(header.font_height(&spr) * 2);

    header.draw(&spr); //Header height is the twice the height of the font


  //Settings for the line graph

    auto content = line_chart(20, header.height()); //(x,y) where the line graph begins

         content

                .height(spr.height() - header.height() * 1.5) //actual height of the line chart

                .width(spr.width() - content.x() * 2) //actual width of the line chart

                .based_on(0.0) //Starting point of y-axis, must be a float

                .show_circle(false) //drawing a cirle at each point, default is on.

                .max_size(MAX_SIZE)

                .value(data) //passing through the data to line graph

                .color(TFT_RED) //Setting the color for the line

                .backgroud(TFT_WHITE)

                .draw(&spr);

    delay(50);

}

- 【CAVEDU講堂】micro:bit V2使用TCS34725顏色感測器模組方法 - 2025/06/27
- 【CAVEDU講堂】NVIDIA Jetson AI Lab 大解密!範例與系統需求介紹 - 2024/10/08
- 【CAVEDU講堂】Google DeepMind使用大語言模型LLM提示詞來產生你的機器人操作程式碼 - 2024/07/30
訂閱MakerPRO知識充電報
與40000位開發者一同掌握科技創新的技術資訊!


